The Hydrogen Evolution Reaction (HER)
[1]:
import pyPourbaix as pb
Perhaps the simplest reaction out of all reactions to be plotted in a Pourbaix diagram is the Hydrogen Evolution Reaction: - \(2\text{H}^+ + 2e^- \rightarrow \text{H}_2(g)\)
It requires only one element, hydrogen, and two species, \(\text{H}^+\) and \(\text{H}_2(g)\). To plot this reaction on a Pourbaix diagram, let’s define both of these species as well as the electrons exchanged between them:
[2]:
species = ('H|+1|, state=aq, dGf=0, dHf=0, Sm=0',
           'H2,    state=g,  dGf=0, dHf=0, Sm=0',
           'e|-1|, state=e,  dGf=0, dHf=0, Sm=0')
Each reactant requires 5 inputs, the formula of the chemical compound, its physical state and the standard molar Gibbs free energy of formation \(G_f^0\) in J/mol, enthalpy of formation \(H_f^0\) in J/mol and entropy \(S_m\) in J/mol/K. The formal charge of each compound can be passed on in vertical lines at the end of the formula. The second input provided is the physical state of the reactant. As indicated above, \(\text{H}^+\) is defined as an aqueous and \(\text{H}_2(g)\) as a gaseous species.
We can deposit all species created in a database that is later fed into the reactive system to be plotted. Note that all thermodynamic parameters, the species charge and the molecular weight are parsed automatically from the provided tuples of species.
[3]:
db = pb.Database.from_default(species)
Tip: The molecular weight of a compound is calculated automatically and does not have to be specified.
Tip: pyPourbaix features 5 different states, solid, aqueous, liquid, gaseous and the dummy state electron. They are abbreviated by their usual indices in chemical formulae, s, aq, l and g. The state electron merely exists to tell the electrons apart from all other reactive constituents.
Warning: The compound formula must make sense. Any string or letter that does not represent an element as displayed in the periodic system of elements will raise an error message.
Now that we defined all compounds part of the Hydrogen Evolution Reaction, we can build a reaction in the form of a string, where all reactants are on the left side of the reaction arrow ‘->’ . The reaction string parser will automatically extract the stoichiometric coefficients of all reactants.
[4]:
reactions = ('2H|+1| + 2e|-1| -> H2',)
Tip: pyPourbaix adopts the notation that all stoichiometric coefficients of reactants are negative and those of the products are positive.
We are now good to create a reactive system. For now, we will not modify any of the physiochemical parameters. Let’s also quickly add both hydrogen and oxygen as the elements to be included in the diagram and define the pH and potential space.
[5]:
hydrogen_system = pb.System()
hydrogen_system.set_database(db)
hydrogen_system.temperature = 298.15
hydrogen_system.pressure = 1.00
hydrogen_system.pHs = (0,10)
hydrogen_system.electrode_potentials = (-1.5,1.5)
hydrogen_system.reference_electrode = ("SHE",0.00)
hydrogen_system.add_elements(["O","H"])
Tip: pyPourbaix has a bunch of reference electrodes saved by default including the standard hydrogen electrode (SHE), the saturated silver-sliver chloride electrode (SCE) or the copper sulfate electrode (CSE), together with their respective electrode potential shifts.
The newly created HER dictionary is passed into the reactive system as follows:
[6]:
hydrogen_system.add_reactions(reactions)
The only thing that is left to do now is to create a Pourbaix diagram object of the class PourbaixDiagram. To compute all potential- and pH-dependent lines on the diagram, we use the command .solve(). Lastly, the diagram is displayed using the .show() command. We specify the plotting backend as matplotlib, since we want the diagram to appear right here in the notebook. For a more fancy version of the plot, the backend can be changed to bokeh. Try and see what happens.
We will also pass the optional argument line_inspection=True into the created object, indicating that we ant to plot the entirety of the potential-pH line of the HER, irrespective of its intersections with other Pouraix lines.
Tip: pyPourbaix currently supports 2 plotting backends, matplotlib and bokeh.
[8]:
hydrogen_diagram = pb.PourbaixDiagram(hydrogen_system, line_inspection=True)
hydrogen_diagram.solve()
hydrogen_diagram.show(backend='matplotlib')
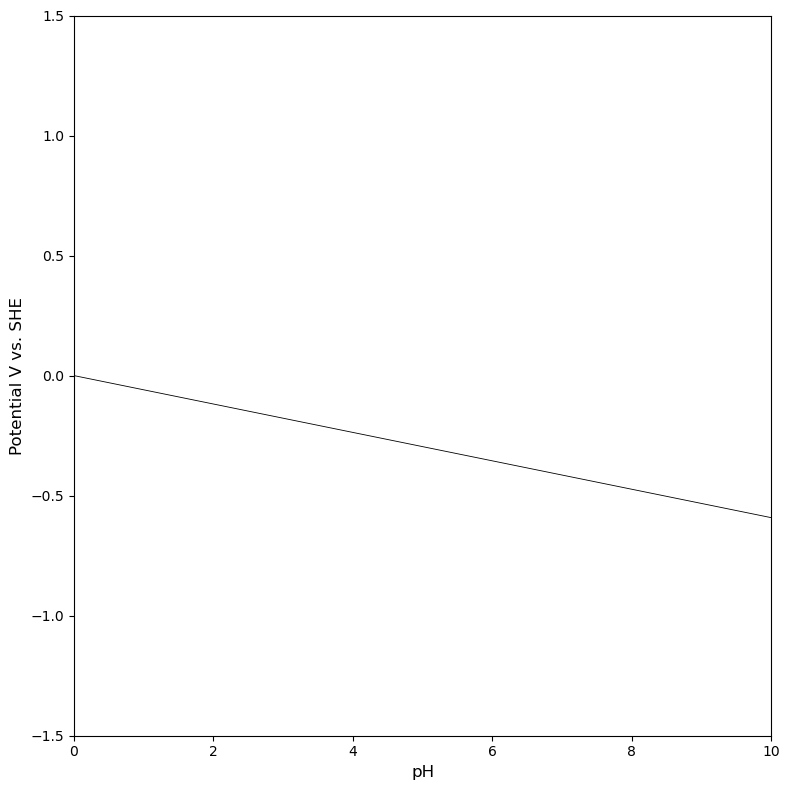
We have just sucessfully plotted our first Pourbaix line. Note that the potential of the Hydrogen Evolution Reaction is equal to 0.00 V at pH = 0, consistent with the specified reference electrode. We will proceed to adding a second reaction to the diagram, the Oxygen Evolution Reaction (OER).
The Oxygen Evolution Reaction (OER)
To plot the Oxygen Evolution Reaction (OER) in similar fashin, we will first have to create all nessecary reactants that have not been defined yet. Below, we defined the compounds \(\text{H}_2\text{O}(l)\) and \(\text{O}_2(g)\) utiising the appropriate physical states and molecular formulae.
[18]:
species = ('H|+1|, state=aq, dGf=0, dHf=0, Sm=0',
           'H2,    state=g,  dGf=0, dHf=0, Sm=0',
           'e|-1|, state=e,  dGf=0, dHf=0, Sm=0',
           'H2O,   state=l,  dGf=-2.37140E+05, dHf=-2.85830E+05, Sm=69.95',
           'O2,    state=g,  dGf=0, dHf=0, Sm=205.137')

db = pb.Database.from_default(species)
As before, we can build a reaction from these two and the previous compounds by formulating a string containing all reactants to the left hand sight of the reaction arrow -> and all products to its right side.
[19]:
reactions = ('2H|+1| + 2e|-1| -> H2',
            'O2 + 4H|+1| + 4e|-1| -> 2H2O')
That’s it. No other diagram parameter has to be re-initialised, we merely have to add the newly created reactions and replot the diagram:
[20]:
hydrogen_system.set_database(db)
hydrogen_system.add_reactions(reactions)
hydrogen_diagram = pb.PourbaixDiagram(hydrogen_system,line_inspection=True)
hydrogen_diagram.solve()
hydrogen_diagram.show(backend='matplotlib')
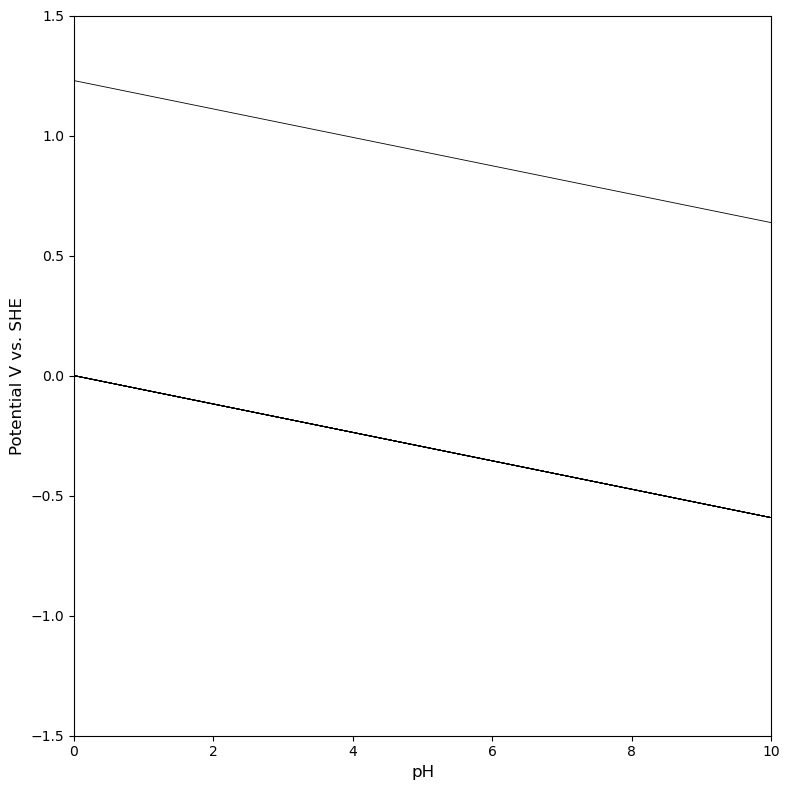
For future diagrams, both the HER and OER are also hard-coded into the PourbaixDiagram class. They can be added to the plot by setting the optional keyword arguments of the diagram to HER=True, OER=True.
We can nicely see that the potential of both lines at pH = 0 equals their standard potential of \(\text{E}^0_{\text{H}^+/\text{H}_2} = 0.00 \ \text{V vs. SHE}\) for the Hydrogen Evolution Reaction (HER) and \(\text{E}^0_{\text{H}_2\text{O}/\text{O}_2} = 1.23 \ \text{V vs. SHE}\) for the Oxygen Evolution Reaction (OER). Both lines feature a slope of \(\sim-0.059\times\text{pH}\). Of course, this is just as it should be. The potential of the Hydrogen Evolution Reaction at standard conditions should be equal to zero, with respect to a reference potential based on the same reaction. But what if we want to shift the entire potential scale by some value, e.g. because we want to plot the Pourbaix diagram with respect to a different reference system? Let’s move on to the next tutorial.